
Bitcoin Resists Macro Pressure As It Diverges From Stock Market Downturn – Insights | TheSpuzz

Source: Bitcoinist
Bitcoin is trading below a crucial demand zone as bears regain control of the market, ending a brief period of optimism and minor upward movement. Selling pressure has resumed after several days of calm, highlighting the ongoing uncertainty surrounding risk assets. Despite this renewed downside, Bitcoin has shown subtle signs of strength compared to traditional financial markets, which continue to struggle under the weight of macroeconomic instability.
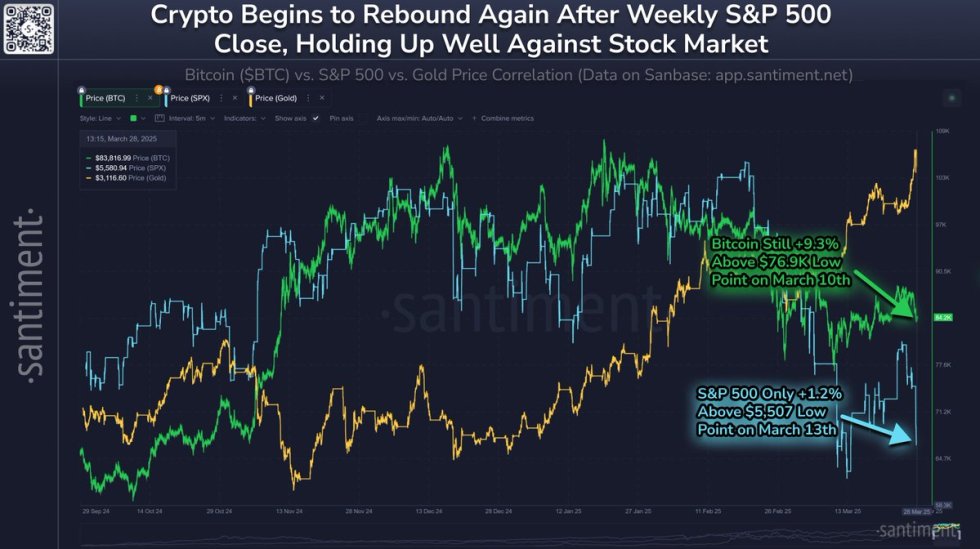
According to insights from Santiment, the S&P 500 and global stock markets have been hit hard by persistent tariff tensions and rising inflation concerns. The S&P 500, in particular, ended the week with a sharp decline, falling to $5,580 — its lowest level since mid-March. In contrast, Bitcoin managed to close the week with a modest gain of +0.4%, holding a market value of approximately $84,300 at the time of writing.
What’s especially notable is Bitcoin’s mild rebound on the 4-hour chart following the stock market’s weekly close. This subtle divergence suggests that, despite macroeconomic headwinds, Bitcoin may be showing early signs of decoupling from traditional equities. As market volatility continues, Bitcoin’s relative stability could signal growing confidence in its long-term value.
Bitcoin Shows Strength As Price Diverges From Falling Equities
Bitcoin’s recent price action has revealed signs of weakness, with bulls struggling to maintain upward momentum. The failure to reclaim key levels has left BTC vulnerable to further downside unless buying pressure returns soon. A recovery phase is urgently needed, especially as broader financial markets continue to reel from persistent trade war fears and rising global tensions. Among risk assets, the crypto market remains one of the most impacted, with sentiment fluctuating in response to ongoing macroeconomic instability.
Despite these challenges, Bitcoin has quietly shown relative strength. At the time of writing, BTC is up about +0.4% for the week, holding a market value of approximately $84,300. In contrast, the S&P 500 experienced a sharp downturn, falling to $5,580 — near its lowest level since March 13. This divergence highlights a potential shift in market behavior.
A key signal of crypto’s subtle strength is Bitcoin’s mild 4-hour rebound following the stock market’s weekly close. This decoupling from equities, while still early, could point to growing trust in digital assets as independent stores of value. In past cycles, especially in 2022, Bitcoin closely mirrored stock market movements. Now, that correlation may be weakening.
These price patterns offer a cautiously bullish sign. When digital assets begin to show strength during periods of global instability — particularly outside traditional trading hours — it suggests growing confidence in their long-term utility. If global markets begin to stabilize or recover, Bitcoin may already be positioned for a stronger move upward, supported by institutional investors who see the current weakness as a long-term accumulation opportunity. For now, bulls must step up to reclaim key levels and confirm the start of a recovery trend.
Price Action Details: Levels To Hold
Bitcoin is currently trading at $83,800 after several days of consolidation below the key $90,000 resistance level. Despite holding above short-term support, bulls have yet to regain meaningful control of the trend. Momentum has faded, and the longer BTC remains below $85,500 — the 200-day moving average (MA) — the more vulnerable the market becomes.

Reclaiming the 200-day MA is now critical. A move back above this level would signal renewed strength and could ignite a recovery rally toward the $89K–$91K resistance zone. Without it, the current consolidation risks turning into a continuation of the broader downtrend.
Meanwhile, downside pressure continues to build. If BTC fails to hold the $82,000 support zone, a dramatic drop could follow. Losing that level would likely trigger stop-losses and panic selling, pushing Bitcoin toward lower demand zones and potentially below the $80,000 mark.
Featured image from Dall-E, chart from TradingView

Editorial Process for bitcoinist is centered on delivering thoroughly researched, accurate, and unbiased content. We uphold strict sourcing standards, and each page undergoes diligent review by our team of top technology experts and seasoned editors. This process ensures the integrity, relevance, and value of our content for our readers.


